After completing research, students will use Easelly to create an infographic that is representative of the information they have found.
Activity 1
Just as students must plan and prepare before writing a research paper, they must also plan before creating an infographic. Using Easelly’s Complete Guide to Infographics e-book, walk students through the planning process before they actually work on the website. Having a plan in place cuts down on the time it takes to actually “build” the infographic. Remind students that the INFO part of the infographic is critical. Making it pretty (changing fonts, colors, etc.) is secondary.
The first step is to show students the similarity in structure between a research paper and an infographic. 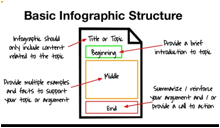
The research question is used to focus the infographic. Just as students need a thesis statement as the basis of a research paper, they must also have a thesis statement for the infographic.
The infographic title should be brief, but catchy to attract the attention of the reader quickly. Students should include their title and thesis on the Infographic planning document.
According to Easelly, “Infographics support focused data with clear design to tell a shareable story in a clear and concise manner.” Creating an infographic forces students to visualize the content they wish to share, and minimize the number of words they use to explain the information. Have students look at the organization in the sample infographics.
What is an Infographic?
10 Steps to Designing an Amazing Infographic
Sample 1 - Expert Driving Techniques
Sample 2 - How Much Does Prom Cost?
Students could work in pairs/small groups to look at the infographics and then discuss what they see with the class. Point out the way that images take up more “real estate” than words in the samples.
After the discussion, have students complete Section 1 of their infographic planning document.
Activity 2
Layout and Design
Once students have a good plan for the images, data, and text they want to use for their infographic, discuss layout and design with them.
Things that students need to remember as they think about layout and design:
-
Limit the color palette (no more than three colors)
-
Use simple graphics
-
Limit the number of font types (2-3 at most)
-
Use data visualizations that most clearly illustrate the data
-
The message should be obvious at a glance
-
Establish a connection between sections (the way transitions link paragraphs)
-
Make sure that graphics and numbers match
Review the 7 basic types of layouts:
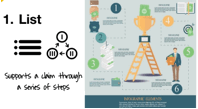 |
A list layout is best used to support a specific claim or argument |
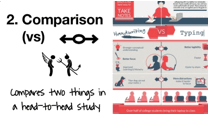 |
A comparison or versus layout is best used to:
-
Highlight differences between similar things
-
Highlight similarities between unlike things
-
Prove on option is superior/inferior to the other
|
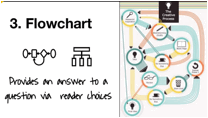 |
The flowchart option is best used to:
|
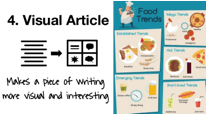 |
The visual article layout makes a piece of writing more visual and is best used to:
|
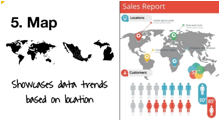 |
The map layout showcases trends based on location. It is best used to compare places and cultures using setting specific data. |
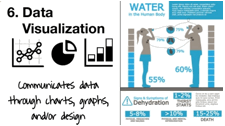 |
The data visualization communicates data through charts, graphics, and design. It is best used to:
|
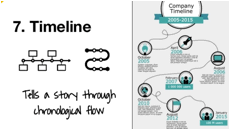 |
The timeline layout tells the story through a chronological flow. It is best used to:
-
Show how something has changed over time
-
Make a long, complicated story easier to understand
-
Show how one thing leads to another
|
After learning about the different types of layouts, students work in their groups to look at the same samples from activity 1 to identify which of the layouts have been utilized in each of the samples. Have a class discussion about the layouts and why they fit the purpose of the information and even brainstorm other possible layouts for the same information. After the class discussion, have students complete section 2 of the Infographic Planning Document which asks students to identify the type of layout that will best suit each of their topics, and explain why that layout fits the information they will be presenting.
Activity 3
Once students have chosen a layout style, they should complete a rough sketch of their infographic. The layout plan should block out what goes where; remind students that this includes designing a space to list citations.
Students can do this digitally, using Google Drawing or on paper. Having a rough sketch of the layout plan will prevent students from being overwhelmed when they first go into Easelly to begin work. Easelly has countless examples and templates, so if students already have a plan in mind, they can focus their search.
Activity 4
Students will log into Easelly and create their infographic. Students will need to create an account in order to use Easelly and to access the infographics once they are completed. If your school uses GAFE (Google Apps) then students should create their account using the Google sign in option. This makes it easier for students to log back into their Easelly accounts since it will be the same sign in they use regularly. If your school doesn’t use Google accounts, then ask students to use some sort of standardized format with their username and password so students remember their username and passwords.
While it is perfectly appropriate for plans to change, encourage students to stick as closely as possible to their plan. Seeing all the “premade” infographics in Easelly makes it tempting to just use one that is there. Ask students to consult with you before changing the layout. This way you can discuss the reason behind the change and make sure that any change stays true to the style that best fits the information the student needs to presents.
Students will need to be reminded to save their work. Once they are finished, students either need to get a shareable link or download a pdf of the infographic. |